Recording Diagnostics on a Azure App Service Hosted Website using Log4Net
I've been working on moving an existing web based software solution into the Azure cloud ecosystem. The solution is tightly integrated with and uses Log4Net as it logging framework. My primary goal, in terms of logging, was to keep as much of my original architecture intact and at the same time make maximum use of the diagnostics infrastructure that is available in Azure.
The official documentation states that calls to the System.Diagnostics.Trace methods are all that is required to start capturing diagnostic information. In summary, this is all I needed to do:
- Enable diagnostics and configure the storage locations (discussed later down the post).
- From within my code write the
Warning,ErrorandInformationmessages via their respective trace methods. - ...
- Azure starts capturing the custom diagnostics information - PROFIT!
Sounds simple enough.
So I thought if I just set up a TraceAppender everything would work fine and that would be the end of it. The results were not what I was expecting and this was the output in my table storage:
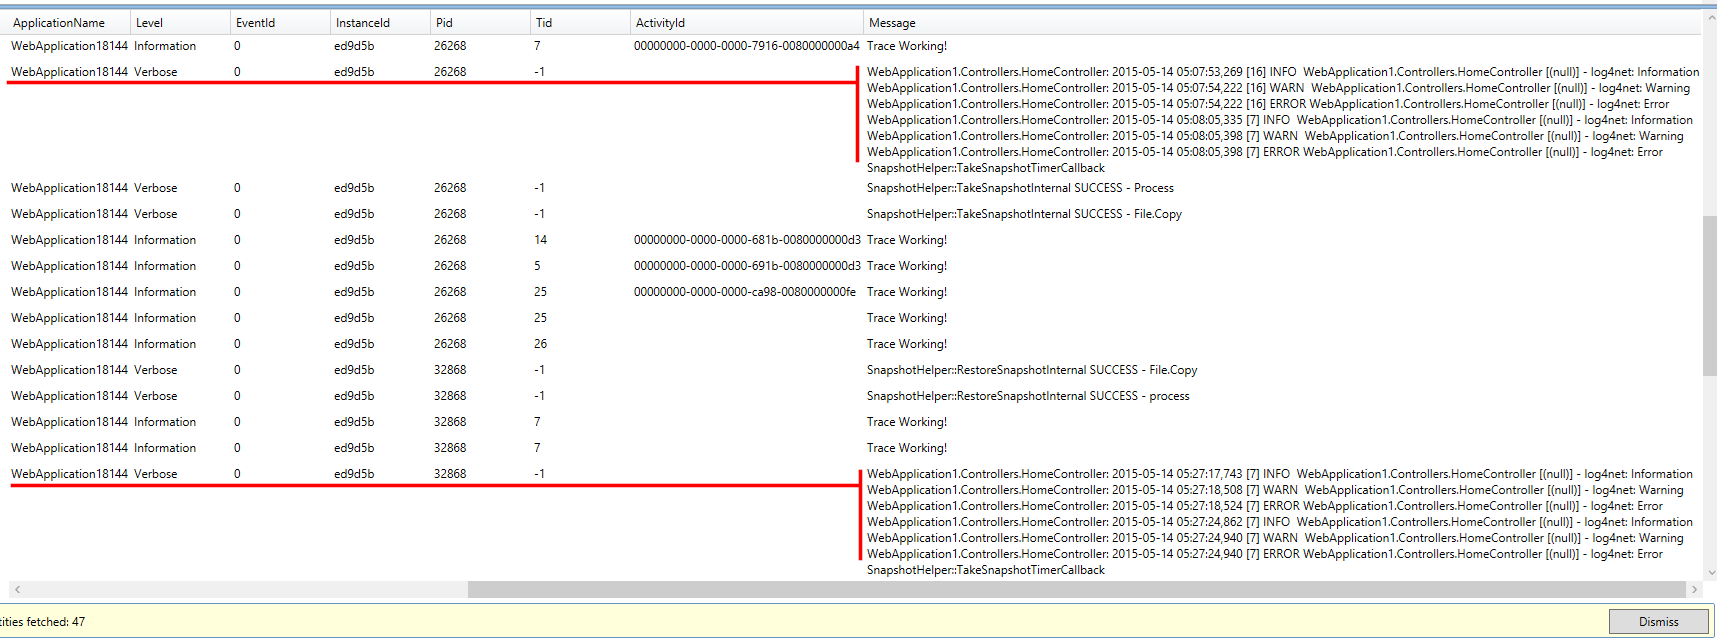
The trace entries are bunched together as a single Verbose entry and the writes appear to be buffered. Not acceptable. I suppose the buffering could be because I had not used the ImmediateFlush option for the TraceAppender, but I need to have each Trace statement to have its own entry in the table.
While there are a lot of posts on the internet on how to setup Log4Net with Azure, most of them appear to be out of date and seem to be compensating for features were not available in the Azure at the time of their implementation. Then there are others that targeted towards integrating with the Cloud Service which is not what I was looking for.
Unable to find any existing implementation, I decided to roll my own appender. I started off by looking at the TraceAppender code and observed that it just does a Trace.Write, which I suppose is why Azure categorizes the entries under the Verbose level. So my implementation would be identical but would make explicit calls to the Trace.TraceWarning, Trace.TraceError and Trace.TraceInformation methods as necessary.
Its quite simple really, this is the gist of it:
protected override void Append(LoggingEvent loggingEvent)
{
    string logMessage = string.Format(this.RenderLoggingEvent(loggingEvent), ((LayoutSkeleton)this.category).Format(loggingEvent));

    if (loggingEvent.Level == Level.Alert ||
        loggingEvent.Level == Level.Critical ||
        loggingEvent.Level == Level.Emergency ||
        loggingEvent.Level == Level.Error ||
        loggingEvent.Level == Level.Fatal ||
        loggingEvent.Level == Level.Log4Net_Debug ||
        loggingEvent.Level == Level.Severe)
    {
        Trace.TraceError(logMessage);
    }
    else if (loggingEvent.Level == Level.Warn)
    {
        Trace.TraceWarning(logMessage);
    }
    else if (loggingEvent.Level == Level.Debug ||
        loggingEvent.Level == Level.Fine ||
        loggingEvent.Level == Level.Finer ||
        loggingEvent.Level == Level.Finest ||
        loggingEvent.Level == Level.Info ||
        loggingEvent.Level == Level.Notice ||
        loggingEvent.Level == Level.Trace ||
        loggingEvent.Level == Level.Verbose)
    {
        Trace.TraceInformation(logMessage);
    }

    if (!this.ImmediateFlush)
    {
        return;
    }

    Trace.Flush();
}
Configure the appender the same as you would the TraceAppender:
<appender name="SimpleTraceAppender" type="Nullfactory.Log4Net.SimpleTraceAppender, Nullfactory.Log4Net">
    <layout type="log4net.Layout.PatternLayout">
        <conversionPattern value="%date [%thread] %-5level %logger [%property{NDC}] - %message%newline" />
    </layout>
</appender>
And finally for the webjob contained in my solution, I paired my custom appender with a ConsoleAppender so that it would automatically take advantage of the web job logging architecture without any additional code.
I've uploaded my full implementation and sample usage here.
Enabling Diagnostics on the Azure Portal
There are couple of steps that need to be done in order to enable diagnostics on the app service:
- Login to the older Azure portal - https://manage.windowsazure.net
- Ensure that you already have a storage account set up. This would house the table that stores the diagnostic entries.
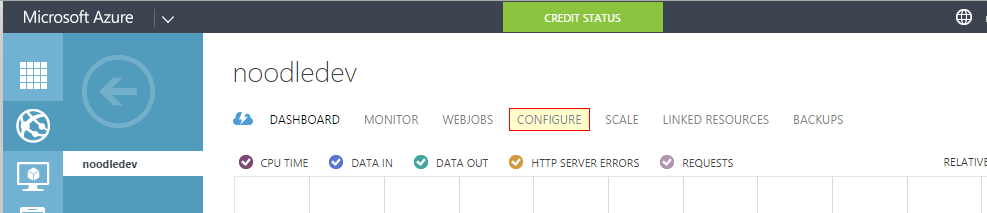
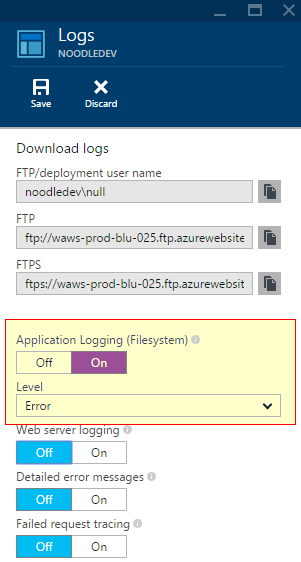
Next, navigate to the web app configuration page.
Enable application logging (table storage) and select a logging level.
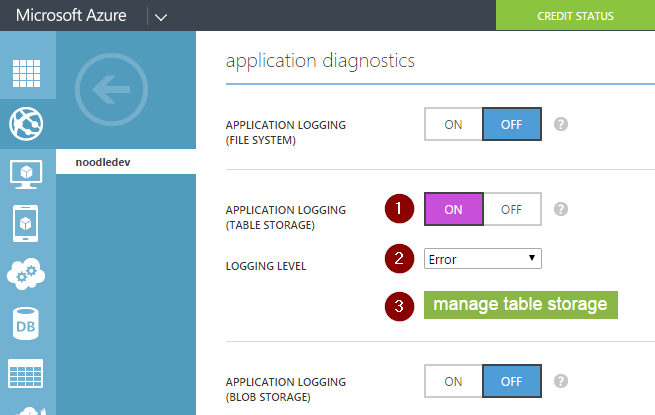
Next click on the
manage table storagebutton allows to configure the storage account and the table into which the diagnostic information is recorded into.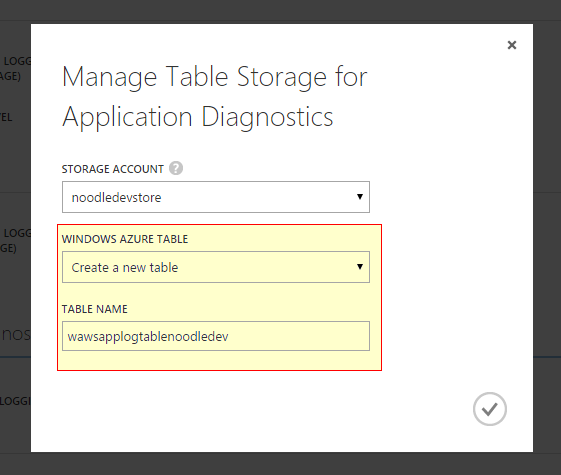
That's it, the web app should start capturing logging information.
There were a few quirks that I faced attempting to set it up:
This how-to provides the following instructions on enabling diagnostics:
When enabling Application Logging you must also select the Logging Level and whether to enable logging to the file system, table storage, or blob storage. While all three storage locations provide the same basic information for logged events, table storage and blob storage log additional information such as the instance ID, thread ID, and a more granular timestamp (tick format) than logging to file system.
When enabling site diagnostics, you must select storage or file system for web server logging. Selecting storage allows you to select a storage account, and then a blob container that the logs will be written to. All other logs for site diagnostics are written to the file system only.
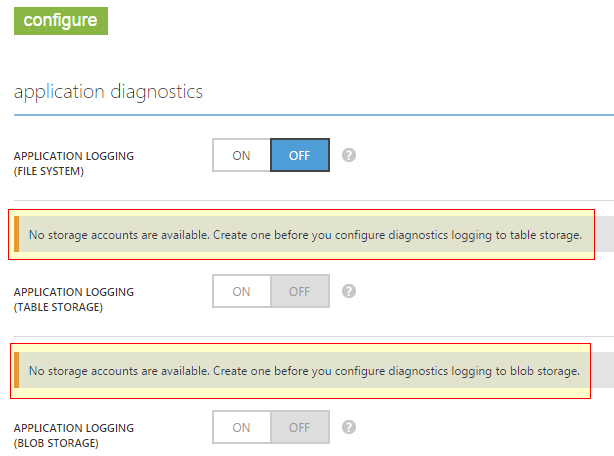
At the time of writing this post the preview portal does not appear to have the diagnostics feature fully ported. While it does have the switch to enable it, it does not provide the options to select the storage location. That's why it is required to be enabled via the older portal.
The newer (v2) storage accounts do not seem to be recognized by the older portal. So if you already using them via the preview portal, you would need to create a second set of storage accounts just for the diagnostics. Again, this is something I think this would be sorted out in future releases
References
- log4net/TraceAppender.cs at trunk · apache/log4net · GitHub
- Enable diagnostics logging for web apps in Azure App Service
- Logging in Azure: Part 1 | Tyler's Azure Blog
- Logging in Azure: Part 2–Table Storage | Tyler's Azure Blog
- Azure Log4Net Appender - Zac Gross
- Logging with log4net and Azure Diagnostics on Web and Worker Roles | Kloud Blog
- Logging with Log4Net on the Azure platform | Cloud Shaper